The probabilistic forecasting model, a substantial improvement in risk management of renewable generation
Point forecasting methodologies entail estimating a single scalar value as the anticipated future value of a target variable. This approach remains ubiquitous across numerous industrial and research applications due to its provision of a definitive, easily interpretable output.
In the context of the energy sector, for instance, a wind power forecasting model may output a point estimate of 35 MWh for generation during a specific hourly interval. The primary strength of point forecasting lies in its operational simplicity, which seamlessly integrates into decision-making workflows and resource-allocation processes.
Nonetheless, this technique intrinsically omits any formal representation of uncertainty surrounding the forecast. As a result, reliance on a solitary estimate can precipitate substantial deviations if exogenous factors—such as abrupt meteorological shifts or turbine outages—differ from those assumed during model training. In contrast, probabilistic forecasting approaches yield a full probability distribution over potential outcomes, thereby enabling explicit quantification of predictive uncertainty.
Rather than asserting that wind generation will be exactly 35 MWh, a probabilistic model might, for example, specify that there is an 80 percent likelihood that generation will fall within the 30–40 MWh range. This distributional insight permits risk-aware decision-making and more robust integration of forecasts into stochastic optimization routines.

Probabilistic forecasting model as a key approach to risk management
Decision-making frameworks that utilize full predictive distributions deliver superior risk-adjusted returns compared to approaches that depend exclusively on point estimates. Although probabilistic methods entail increased implementation and analytical complexity, they are indispensable in domains where rigorous risk management is critical—such as energy, meteorology, and finance. By generating a complete distribution of possible outcomes with associated probability weights, probabilistic models enable:
- Enhanced Risk Management through Scenario Analysis: Incorporating multiple potential scenarios allows stakeholders to quantify downside exposure and tailor mitigation strategies proactively.
- Optimization of Trading and Operational Strategies: Designing strategies that explicitly account for distributional uncertainty leads to more robust economic performance under volatile conditions.
Conformal Prediction: Measuring uncertainty
It is critical to recognize that the mere provision of probability‐weighted forecasts does not ensure that prediction intervals are properly calibrated or that they accurately reflect the uncertainty inherent in the forecasting system. Consequently, forecasting algorithms must incorporate mechanisms that produce prediction intervals with empirically valid coverage, even in finite‐sample settings.
Conformal Prediction (CP) constitutes a robust framework for generating prediction intervals with formal validity guarantees, without imposing any assumptions regarding the underlying data distribution. Its principal advantage lies in its ability to deliver coverage guarantees at any prescribed confidence level, making it especially well‐suited for probabilistic forecasting in the energy sector.
In our experience at Gnarum, CP has proven to be an indispensable calibration paradigm, conferring enhanced reliability to forecasting systems.En la experiencia de Gnarum, CP se ha consolidado como un paradigma de calibración muy valiosa para aportar confiabilidad a los sistemas de forecasting.
Key attributes of Conformal Prediction include:
- Distributional Flexibility: CP requires no prior assumptions about the data distribution, allowing interval construction to adapt to arbitrary, real‐world data patterns.
- Model Agnosticism: The framework can be overlaid on any predictive model—from classical linear regression to complex deep neural networks—without modification to the underlying algorithm.
- Dynamic Adaptability: By tailoring calibration strategies to specific operational contexts, one can adjust the width of prediction intervals in real-time, based on the evolving performance of the base point‐prediction models.

Evaluation metrics
Evaluation metrics for a probabilistic forecasting system must encompass both point‐forecast accuracy and the validity and sharpness of associated prediction intervals. Below, we outline the primary metrics used for evaluating point predictions, organized by the norm employed to quantify error.
1. Point Forecasting
Metrics for assessing point‐forecast accuracy are typically divided into two categories based on the underlying norm: L₁‐norm–based metrics and L₂‐norm–based metrics.
L₁‐Norm–Based Metrics
L₁‐norm metrics compute errors as the absolute deviations between predicted and observed values. Their key characteristics include:
- Robustness to Outliers: Because absolute errors grow linearly, large deviations exert less influence on the overall metric relative to squared‐error measures.
- Intuitive Interpretation: Error is expressed in the same units and scale of the target variable, facilitating direct, domain‐relevant understanding.
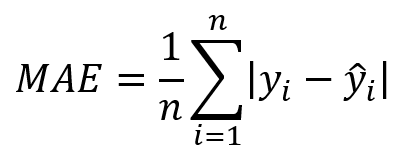
- Primary Indicator: The standard metric is the Mean Absolute Error (MAE), defined as:
L₂‐Norm–Based Metrics
L₂‐norm metrics evaluate error by squaring the deviations and, if desired, returning to the original units via a square‐root transformation. Their main properties are:
- Greater Penalty on Large Deviations: Squaring errors amplifies the impact of large residuals, making L₂ metrics more sensitive to outliers.
- Standard Indicator: The Root Mean Squared Error (RMSE) is computed as:
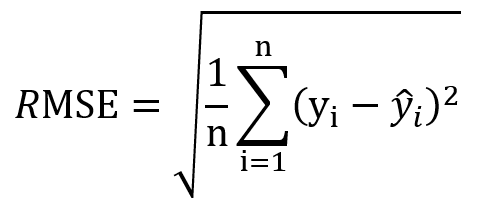
By taking the square root of the Mean Squared Error (MSE), RMSE expresses error in the original units of the variable, enabling direct comparison with observed values. Selecting between them depends on the domain’s tolerance for outliers and the need for intuitive versus variance‐sensitive error quantification.
2. Probabilistic forecasting model
Coverage rates
- Nominal coverage: The nominal coverage rate represents the prescribed confidence level associated with a given prediction interval. For instance, specifying an 80 % nominal coverage for the P10–P90 interval implies that, under ideal calibration, the true outcome is expected to lie within that interval in 80 % of cases.
- Empirical coverage: The empirical coverage rate is computed as the fraction of observed values that fall inside the generated prediction interval. It provides a data‐driven measure of how often the intervals achieve their intended nominal level.

- If the empirical coverage rate is lower than the nominal coverage level, the prediction intervals are too narrow and systematically underestimate the true uncertainty of the forecasting system. In this scenario, actual outcomes fall outside the constructed intervals more often than intended, indicating under-coverage and insufficient interval width.
- Conversely, when empirical coverage exceeds the nominal level, the model overestimates the inherent uncertainty and producing overly conservative intervals. In such cases, the prediction intervals are wider than necessary, causing actual observations to lie within the interval more frequently than the prescribed confidence level.
Coverage test
- High p-Value: Implies that any observed discrepancy between empirical and nominal coverage is not statistically significant, indicating that the model’s prediction intervals are well calibrated..
- Low p-Value: Denotes a statistically significant divergence between observed exception rates and the nominal level, signaling potential calibration deficiencies in the forecasting system.
Coverage analysis enables verification that the extremal quantiles of the predictive distribution—for example, the P10–P90 interval at an 80 % nominal confidence level—accurately represent the true uncertainty.
Average length of the prediction Interval
Once the prediction intervals have been calibrated, the finite‐sample uncertainty of the forecasting system is quantified by the average interval length, defined as the difference between the estimated upper and lower bounds.
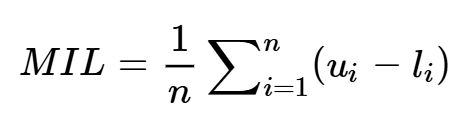
Where:
- ui: upper limit of the prediction interval.
- li: lower limit of the prediction interval.
Winkler Score
The Winkler Score is an integrated metric for evaluating prediction‐interval quality by jointly accounting for interval width and miscoverage penalties.

Key aspects of the Winkler Score include:
- Interval Sharpness: When the observed value falls inside the interval, the score equals the interval’s length, thereby rewarding narrower intervals.
- Penalty for Miscoverage: If the actual value is outside the bound a heavy penalty is added. Intervals which fail to capture the true value incur a larger score, reflecting both the magnitude and frequency of mispredictions.
Consequently, lower average Winkler Scores indicate prediction intervals that are both tight and well‐calibrated, making this metric particularly valuable for comparing probabilistic forecasting systems in energy, finance, and other risk‐sensitive domains.
Gnarum possesses extensive expertise in deploying probabilistic forecasting systems, with a particular focus on photovoltaic and wind energy—both on‐shore and off‐shore.
Given the intrinsic variability of wind resources, accurate forecasting in this domain represents one of the most technically demanding challenges in renewable energy. Addressing this challenge necessitates robust, rigorously calibrated models that generate valid confidence intervals. Over years of methodical technical development and continuous validation, Gnarum has achieved superior performance in global benchmarking exercises, consistently outperforming leading forecasting providers.
Moreover, Gnarum serves as an accredited supplier within multi‐vendor frameworks for several European transmission system operators (TSOs). In these settings, diverse forecasting outputs are consolidated to assess energy flows across various grid nodes.
By integrating probabilistic forecasting underpinned by Conformal Prediction techniques, Gnarum delivers solutions that are inherently robust, transparent, and reliably calibrated. This combined approach enables stakeholders to manage high‐uncertainty conditions effectively and optimize operational decision‐making in today’s dynamic energy markets.